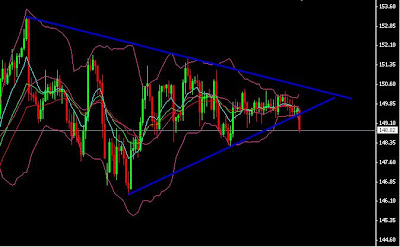
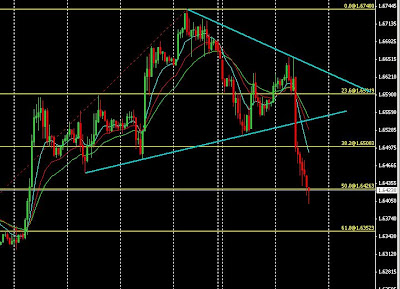
GBPJPY was stuck within a huge triangle for quite some time now. For this very volatile pair long term consolidation is unusual and especially over the past few days the daily range has been minimal. Price finally broke trendline support so we can expect relatively large move. Bollinger bands with standard settings of 20, 2 are very narrow which is often a precursor of a large move.
Price has clearly broken to the downside so short position with stop above daily range and above trendline resistance+upper BB. Stop is relatively wide but we can expect a large move so risk/reward is still favorable.
Wednesday, November 18, 2009
Thursday, November 5, 2009
medium term short opportunity in NZDUSD
The economic data from New Zealand disappointed again. Employment q/q fell again, this time by 0.8%, worse than expected -0.3% from -0.4% the previous quarter. Equally bad came out the unemployment number. Unemployment increased to 6.5%, exp. 6.4% from previous 6%.
Both numbers point to worsening labor market situation. Improvement in the labor market is necessary requirement for overall macroeconomic conditions of NZ so we will probably not be positively surprised by upcoming economic releases. New Zealand is an important exporter of dairy products and meat. We can be sure that the huge appreciation that the kiwi experienced (0.48 just in March!!!) is very negative for exporters. Fundamentally, NZDUSD should head down.
Looking at daily chart, we can see that the downtrend has already started. The price fell below 10, 20 and 30 EMA and broke below long term upward sloping trendline support. The price than retraced, tested this trendline (now resistance) and bounced off. The aformentioned EMAs started to point down which confirms that current trend is down.
For medium term trade with favorable risk/reward we can open short position at current price (around 7210) with stop above confluence of trendline resistance and 30 day EMA at 7320 risking 110 points. If the price breaks below previous low at 7094 it confirms that retracement of the bull move started and we will see significantly lower levels in the future.
Potentional risk is seen in continued USD selling with higher equities and commodities, especially gold and oil.
Monday, November 2, 2009
Buy CAD, Euro near critical points
Markets were nervous today despite all positive news coming from the US. ISM and pending homes sales both surprised to the upside but after initial knee jerk reaction risk trades were sold off. Equities closed on the positive side but during the day there were many large moves both to the upside and to the downside.
USD index still looks good and if we hold 75.95 - 76 level there is a good chance that we will break to the upside forming a flagpole. It seems that inverted head and shoulder is being formed and upside break would target 77.30 area.
Gold is looking very well. It held a horizontal resistance turned support trendline, bounced off upward sloping channel line and it looks poised for another move higher. Only break below 1025 would turn biad down and that seem highly improbable now.
In currencies I'd like to point out a great CAD long opportunity. USDCAD daily has a nice downward sloping trendline that should provide strong selling pressure. Short positions are targetting 1.0630 the least and bias would turn up only if we break above 1.0845. EURCAD daily has a similar set up with clearly defined trendline.
EURUSD is very close to two critical points: bullish break of 1.4850 would signal resumption of a bullish move that would target 1.51 and bearish break of 1.4670 would signal that head and shoulders may be developing with neckline in 1.45 area. Buy stop and sell stop at these two areas with 50 pip stop loss and 150 pip limit make sense and provide excellent risk/reward ratio.
Thursday, October 29, 2009
Risk trades are back after US GDP. For how long?
US GDP coming way better than expected at 3.5% brought back the risk trades. Long gone are times when better than expected US news meant stronger USD. In today's environment strong US data means recession is over, the economic patient is cured, we all sell the USD and live happily forever after. Well, let's see how tomorrows PMI numbers come out. If they disappoint, we could very easily lose today's gains in equities and commodities as risk aversion would likely come back.
As said before, USD was sold across the board (except against JPY of course). Gold bounced of two trendlines support and formed a nice bullish engulfing pattern. Bias would turn down only in case of a break of 1030.
The USD index broke a very important downward sloping trendline few days ago and came down to test it. In an ideal world it would bounce off this "resistance turned to support". If we hold 75.70 than the bias is still up.
I expect risk trades to continue (sell USD, buy equities and commodities)to continue through Asia and probably London session as well. However, if Chicago PMI disappoints than we could see a reversal. In EURUSD this idea translates to up move to 4920 (61.8% of move from 5060 to 4680) and then back down to 4700 area.
There is also an interesting set up in GBPUSD. Daily chart shows two resistance points: 6680 and 6745. We can expect a strong selling pressure there. However, if this level gives way, there is really no resistance above it and price should easily reach 1.7050 level (previous high)
Wednesday, October 14, 2009
USD collapsing, major psychological levels within reach
USD continues to collapse against virtually every currency. CHF parity first mentioned on 10/8 now seems even more likely as we trade around 1.0125. USDCAD in a strong downtrend is now trading just above 1.02 (150 points from a level where I first mentioned going short on Monday) is probably on the way to parity as well. EURUSD in now only a whisker from a major 1.5 level and now it would be almost impolite not to reach that level. The aussie continues its ascend as expected reaching a high of 92. Traders who followed my advice from last week to continue buying AUDUSD should have handsome profits by now.
Story of the day is Dow reaching 10000 and more importantly closing above this level at 10015. I still think that retracement (and probably a large one) will happen. But for now it does not make sense to fight the bullish trend.
USD index looks very poor again (or still?) and is closing very weak. Currently trading at candle's low around 75.27. The only hope now lies in a trendline support that comes around 75.15. Maybe will touch it when EURUSD breaks 1.50?
Gold made only marginally higher high but held yesterdays low and is closing reasonably strong. Oil which I mentioned last that there was a possibility of it breaking out of the recent range did break up higher and is on the way to touch 76.
When it comes to trading, my strategy does not change for now. Continue to sell USD on strength. Retracement is coming but so far there is no indication as to when it will come. Before I see any turns (hammers or at least doji, breaks of trendline supports/resistances or close below previous days lows/highs it doesn't make sense to fight the trend. Remember "trend is your friend". Keep your stops tight and be agressive with taking profits. Good trades.
Monday, October 12, 2009
USDCAD breaks support, downside momentum increases
As expected, the USD continues to be sold on rallies across the board (with the exception of GBP). One of the largest moves was seen against the Canadian dollar.
The CAD appreciated significantly after last Friday’s great labor report. Unemployment decreased greatly from 8.7% to 8.4% and number of jobs increased by 30.6 thousand vs. exp. 4.9 thousand confirming improving fundamentals.
Selling pressure was sufficient to break a trendline support at around 1.0450 and reached a low 1.0409. After a short period of consolidation the pair broke below the psychologically important 1.04 level and reached 1.0317 today. Daily chart shows a strong momentum to the downside and unless we break up and close around 1.04 (in which case the price would form a hammer formation) today’s close will be another huge bearish candle pointing to additional USDCAD weakness (CAD strength).
Placing a sell stop below today’s low at around 1.0310 with 1.0350 stop and 1.0240 limit looks like a good strategy to take advantage of the strong bearish momentum.
Thursday, October 8, 2009
Further AUD strength and USD weakness anticipated
The Aussie has behaved exactly as anticipated. AUD appreciated across the board reaching a high of 9090 against the buck (from 8918 in the last post when going long was advised). Last night's labor reports underpinned the aussie as unemployment dropped and the number of jobs created increased as well. The Australian economy is getting a firmer footing and if we continue to see positive news releases we may very well get another rate hike before the year end. The yield differential between the AUD and the rest of the world (especially the USD) will widen further and this should propel the AUD higher. The second recommendation to buy EURCHF at 5100 also worked out very nicely as we are trading at around 5180.
The greenback was sold across the board today and the USD index looks really poor. The price broke below all major support levels and unless we trade back above 76.50 the bias is clearly down. The USD is collapsing practically against all majors. All charts have important moving averages (10, 50, 100 or even 200 hour) stacked in a "correct" order pointing to strong momentum and further USD losses ahead. CHF parity anyone?
Spot gold reached higher levels again and one must ask whether oil will follow and break out of the relatively narrow range where is has been stuck for many months now. Again, if oil breaks out higher, the USD will continue its rapid decline.
As far as trading: do not fight the trend (at least not yet...) and do not buy the USD yet. The time may come but not now. So continue to sell USD on strength (test of 20 ema on hourly chart) preferably against fundamentally stronger currencies like the AUD.
Tuesday, October 6, 2009
Aussie flies as RBA unexpectedly increases cash rate by 0.25% bp.
The aussie is boosted across the board as The Reserve Bank of Australia unexpectedly increased rates from 3.0% to 3.25%. The RBA is the first central bank that started to tighten its monetary policy lifting the cash rate from it's 49 years low. What central bank is next?
Against the greenback the aussie advanced from 8754 to 8918 (for now). Against the sterling, the aussie also appreciated considerably dragging the GBPAUD pair from 1.8219 to 1.7861 (current lows). This move was exacerbated by much worse than expected GBP manufacturing production coming at -1.9% vs exp. +0.4%. As a consequence GBP is a relative strength loser.
USD index broke below it's uptrend support around 76.55 area and reached a low of 76.15. If 76.00 gives way another round of USD selling will be upon us. The talk of meetings among Arab states, China, Russia and France to stop using USD for oil trading certainly did not help the buck.
When it comes to trading, we can expect few more sessions of AUD strength, so continue to buy on pullbacks. EURCHF is close to 1.51 again so buying with expectation of SNB intervention, or at least a talk of intervention that would push EURCHF up makes sense.
Thursday, October 1, 2009
USD strength to continue. At least till NFP
Buying the greenback on pullbacks have proven to be successful strategy over the past few days. This trend is likely to continue at least until we get new labor market data. USD index quite nicely held the trendline, did not break yesterday's low and bounced back rather significantly. As of now, the dollar index is looking pretty good and I am still waiting for the much anticipated test of the downward sloping trendline which is currently around the 77.65 area.
Gold chart looks promising to the downside further reassuring my USD bullish bias. Recent recovery proved to be short lived, price bounced off the downward sloping trendline and today the price of the yellow metal broke back below 1000 level. I'm still targeting 960 - 970 area within the next few days.
EURUSD continues to drift lower with 10, 20 and 30h emas all stacked in correct order pointing to additional EUR weakness. EURGBP looks pretty weak as well - I predict that EURGBP will sell down pushing euro lower against the buck with it. Recent concerns that EU commissioner expressed regarding the strength of the Euro certainly helped. I also want to point out nice bearish reversal on the AUDUSD daily. Bearish engulfing pattern that broke below 10 day ema points to furhter AUD weakness.
Tomorrow's NFP release may alter the currency outlook. But given that the equity markets sold off very aggressively today (Dow -2.1% and S&P -2.58%) the risk aversion trades seem to be back. If NFP and maybe more importantly the unemployment rate bring surprisingly negative data, the skepticism regarding US recovery may increase bringing equity markets down, the dollar up and commodities down.
Monday, September 28, 2009
Few interesting charts...
EURUSD is in a nice downtrending channel with appropriately stacked 10, 20 and 30h ema. It has been forming lower lows and lower highs for about a week now. Situation is very similar when looking at USDCHF. USD strength has been exhibited in form of higher sloping moving averages and up channel. Further USD strength is expected, keep buying USD on pullbacks.
USDJPY has been in a strong downtrend for quite some time now. Area 90.35 - 90.50 is a resistance formed by 50% retracement from 92.52 to 88.22 and by a downward sloping trendline. Buy JPY on pullbacks to 90.40
Thursday, September 24, 2009
USD continues to strengthen. Reversal is here...
USD continues to get stronger across the board. Oil dropping like a stone (currently 65.90) has big implications for the USD (and specifically against the CAD). It's likely that USD has formed a bottom and we'll get the much needed retracement.
US equities are in red (S&P down 1.18%) and there is plenty of room to the downside.
Chart shows a great confluence of events: EURUSD broke below 10 ema, previous candle was also red, MACD formed a bearish cross and Stochastics fell below 80. Keep shorting the Euro. It wants to go down now.
US equities are in red (S&P down 1.18%) and there is plenty of room to the downside.
Chart shows a great confluence of events: EURUSD broke below 10 ema, previous candle was also red, MACD formed a bearish cross and Stochastics fell below 80. Keep shorting the Euro. It wants to go down now.
This is probably it. Get ready for USD bounce
USD retraced all of the losses it incurred during the London session following weaker German Ifo 91.3 vs exp. 92.1 and especially after weaker US existing home sales 5.10M vs. exp. 5.36M. GBPUSD melted down from 6385 to 6067(!). USDCAD jumped from 0707 to 0890 as wti crude is hammered to 66.40 and AUDUSD dropped from 8770 to 8667 as XAUUSD dropped from 1019 to 993. USD index jumped from 76.10 to 76.79. Strength in the buck is reflected in the S&P which is currently in the red by about 0.9%. Unless the buck retraces these gains, which looks unlikely at this point as there are no more news releases, daily charts will show a very toppish formations.
Further USD strength is likely as dollar negative momentum is exhausted and traders have started to close the USD shorts to realize profits especially because of the G20 meeting. Buy USD on pullbacks to 10-20 hour ema.
Wednesday, September 23, 2009
Tuesday, September 22, 2009
Short EURGBP against 91.00
Nobody likes the USD... The buck was sold across the board today and reversed all of its previous gains sending USD index from highs of 77 to below 76. Dollar selling momentum is too strong. The greenback is weak again. However, when the USD strength comes, it will come and take everyone by surprise (maybe tomorrow FOMC statement?). I do not feel comfortable selling USD at these levels so lets look at some cross action.
EURGBP formed a very nice bearish candle formation that gives us great short opportunity. Recent rally stopped right at the 61.8% retracement from March high of 9492 to May low of 8399. Multiple bullish days were followed by a clear signs of bullish move exhaustion: doji followed by an inverted hammer and yesterday a bearish candle. Go short at current levels (0.9042) with a stop above 91. First target is a trendline resistance turned support around 8950. At this level close 1/2 and trail rest with 40 pip trailing stop.
GBPUSD formed a long bullish candle after a hammer pointing to additional strength. GBPUSD move up would help to push EURGBP down.
Monday, September 21, 2009
Interesting week ahead, USD stronger as expected.
USD is stronger across the board at the beginning of what is likely to be an interesting week. FOMC meeting, G20 meeting, German IFO and other events and news releases promise exciting and volatile week. As noted last week, USD index likely formed a bottom at around 76.20 and bounced nicely to 77 level. Trendline resistance comes above 78 so there is plenty of space for additional follow through. Supporting the USD strength is oil below 70 and gold breaking 1000 once again. US equities are currently down about 0.4%.
Looking at charts, 10, 20 and 30h emas are nicely stacked in correct order pointing to additional USD strength. Buying USD on pullbacks seems viable for the next couple of days. For today the move is likely to be exhausted so wait for a test of 10h ema, stop above/below 20 ema (or alternatively use trendlines to initiate trades).
Thursday, September 17, 2009
Turn may be coming tomorrow, multiple dojis and hammers
Turn in many markets can be finally upon us... it is about time. After two weeks of relentless USD selling, the charts started to show signs of possible reversals. Dojis and hammers were formed on many currency pairs and gold even posted lower close compared to open. Obviously depending on your broker your chart may look slightly differently (some consider the end of the day 5pm NY time, some midnight London time and some even midnight NY time.
Many traders use trading strategies in which they open long positions after 7-9 bearish daily candles (or short position after 7-9 bullish candles). Regardless of what the number of days is, US dollar index formed bearish candles over the past 10 days. Bounce is due and return to 77.50 - 78 area is very likely. It's just question of time.
Friday will bring a triple witching hour (simultaneous expiration of equity index futures; equity index options and equity options) so we can expect high volatility. This volatility will probably bring the recent rally to a stop.
Trading plan: bet that markets will turn around with stop above swing high.
Wednesday, September 16, 2009
EURUSD breaks 12/18/2008 highs
No stopping for EURUSD. The european currency breached another major resistance level at 1.4718 from 12/18/2008 and reached a high of 1.4733 after another round of USD selling. USD index broke below the 76.50 and reached a low of 76.15. Increasing price of gold and oil contributed to USD weakness.
As mentioned yesterday, GBPUSD continues to bump up against a resistance at 6490 which propped EURGBP up to 8926 a level not seen since beginning of May.
On fundamental front: US headline CPI surprised to the upside coming at 0.4% exp. 0.3% while core came as expected at 0.1%. However, TIC data came much lower than expected (15.3B vs. exp. 65.3B, 90.2B last) showing slowing foreign demand for US assets.
EURUSD will correct, it is just a question of time. Considering recent run-up, the correction is not too far. However, no sense trying to pick a top. The trend is up as long as 4630 does not give way. So continue buying EURUSD on pullbacks. Be aggressive with taking profits though.
Tuesday, September 15, 2009
GBP hit after BoE remarks
GBP is sold across the board after BoE remarks that reducing interest rates on reserves is being considered. GBPUSD is down from 1.6661 to 1.6413, EURGBP is up from 8771 to 8895. On the news front: GBP CPI was higher than expected (1.6% yoy vs. 1.4%). German ZEW disappointed at 87.7 vs. exp. 59.9. US retail sales and PPI came up better than expected at 1.1% vs 0.4% core and 1.7% vs. exp 0.9%.
USDCAD turned around little earlier than expected and reached only 0871 before dropping 100 points. EURCAD behaved more predictably. As assumed yesterday, it reached a high of 5880 before dropping to 5740!!! That's the power of trendlines on the daily chart.
Given the significant move in GBPUSD and the underlying reason for the move the trading plan will be to sell GBPUSD on strength. Selling a test of 10 hour ema (currently at 6490) with a stop above 20 h ema advised.
Monday, September 14, 2009
Canadian dollar approaching a major resistance
Canadian dollar is approaching a major resistance against the buck and the euro. Trendline on the daily is coming at around 1.5915 in EURCAD and 1.0970 in USDCAD. In calm technically driven trading these trendlines will probably keep prices under pressure. However, if oil plummets (head and shoulders formation is being formed) that could give the CAN$ reason to weaken rather substantially. As long as oil trades above 67, sell the CAD crosses. If oil drops below 67 CAD crosses are likely to shoot higher. Tomorrow is turn around Tuesday so large moves are likely.
USD index forming a bottom
USD index is probably forming a bottom. On 8 hour chart, MACD just made a bullish crossover and at the same time the index broke a 10 EMA to the upside. Turn around Tuesday may be coming!
I like USDCHF to the upside. As mentioned earlier, USD weakness has been overextended and it is time for a pullback. Even daily oscillators started to show loss of momentum. EURCHF is currently around 1.5128 which is pretty close to the line in sand that SNB is watching. This should prevent further CHF strength. Time for an intervention?
USD continues to be sold in the ongoing session.
USD continues to suffer during the ongoing session. EURUSD reached a higher high at 1.4653, USDCHF reached a lower low at 1.0327. However, against the kiwi USD is stronger after yesterday's retail sales disappointed (-0.5% vs exp. +0.6%). Despite the present USD weakness, the move has been extended and reached what I consider unsustainable levels. Pullback (USD strength) is expected. Against the EUR I expect to see levels around 1.42 and against the kiwi, where strength is already showing, to levels around 0.6770. Oil below 69 should help to push CAD lower against the buck. USDCAD seems to have formed a bottom and bias shifted to the upside - buy on pullbacks. US equities are already in the red and I expect to see further weakness after Obama speech.
Good trades.
Good trades.
Thursday, September 10, 2009
GBP breaking to the upside after no change in QE
GBPUSD broke up and reached 1.6675 after BoE announced no change is Asset Purchase Facility. As expected, there was no change in official bank rate currently at 0.50%. EURGBP sold down from 8827 to 8731 and formed a nice bearish engulfing pattern on the daily chart. Further downside probable.
In the US unemployment claims were better than expected coming at 550k vs. 560k expected. US trade deficit widened to 32B vs exp. 27.1B. In Canada rates were left as expected at 0.25% and CAN trade balance came at -1.4B vs. exp. -0.1B. USDCAD strengthened from 1.0880 to 1.0795.
Gold broke back below 1000 and dipped to 984. Gold started to form lower lows and lower highs on the hourly chart and faces trendline resistance at 995. EUR was able to make a new high against the buck reaching 4607 before breaking down 100 points. If we fail to close above 4575 nice doji will be formed on the daily chart pointing to stalling up momentum. Light shorts with a stop above swing high advised.
Good trades
Wednesday, September 9, 2009
EURUSD weekly chart - BB resistance and 61.8% resistance
EURUSD may stall its uptrend as there are two very important resistance levels on the weekly chart. (current price 1.4562) First, we have a bollinger band (settings: 20, 2) resistance around 1.4625 area and at the same area we have 61.8% retracement of the fall from 1.6035 to 1.2329. These two areas may provide a strong resistance that could be exploited on the short side. Relatively large stop and limit advisable.
Good trades.
Good trades.
Another round of USD weakness
As expected, USD continues it's move down. As mentioned yesterday, until this trend ends, continue to sell USD on strength (test of 10 or 20 ema). The aussie continues its ascend, reaching 86.68 despite yesterday's fundamentally weak retail sales (-1% vs. +0.6% exp.) and home loans numbers (-2% vs -1.5% exp). USDCAD may be forming a bottom as it failed to create a new low despite better than expected housing numbers (150k vs 138k). Relative strength winner is the JPY which sent all JPY crosses way down. USDJPY tested a July's low at 91.73 and USDCHF is testing lows from December 08. Gold failed to make a new high as well which suggests consolidation of large gains seen over the past 10 days.
Tuesday, September 8, 2009
USD sold across the board, key levels breached
Last week when gold broke the triangle on a daily chart to the upside I asked what leads and what follows. It is clear now... Gold regained 1000 level, oil is above 70 and international equities are all in black. As a consequence USD has been sold relentlessly across the board. Largest moves seen over the past 24 hours in EUR (+1.22%) and CHF (USDCHF -1.39%). USDCAD continues its downmove it started on Friday after employment report surprised to the upside 27.1k vs -12.4k.
Considering the magnitude of the move additional follow through is likely. 10, 20 and 30 EMAs are stacked in correct order pointing to further USD selling. Trading strategy should be based on selling USD on strength. However, for today the move is likely to be exhausted, plus EUR is facing a trendline resistance on a daily chart. Selling EUR now against the swing high makes sense. Limits at 1.4460
Good Trades.
Thursday, September 3, 2009
Gold continues ascend and breaks out from a triangle formation
Who's buying all that gold? Gold broke to the upside from the triangle mentioned yesterday. That alone should have sent USD down but it did not... USD was sold off in the morning but it regained a portion of the loss. Euro did not follow gold's example and failed to break it's triangle. Clearly NY session has a long way to go but if EURUSD fails to close above 4300 (currently 4260) then the candle formation will look very bearish again.
Unemployment claims were slightly disappointing coming at 570k vs exp. 563k. ISM came out in line with expectations at 48.4 still pointing to contraction. Oil dipped below 68/b while US equities are currently up about 0.2%.
Today's play is short USDJPY around 92.65-75 area (currently 92.55) below trendline resistance. Downward sloping EMAs pointing to further weakness and Williams %R rolled off overbought area pointing to lower prices ahead. Target is mid July lows at 91.75.
Good trades.
Wednesday, September 2, 2009
USD retraces portion of yesterday's gain
USD is down slightly compared to yesterday close. Market dynamics are very interesting now with USD down, equities down, oil down and gold UP hugely from 953 to 975. Question is what is leading and what is lagging...
Fundamentals today were not so good: ADP -298k, worse than expected -250k (but less negative than last time -360k) and factory orders disappointing as well (1.3% vs exp. 2.3%).
Against all majors the greenback created bearish engulfing candle yesterday and now it is retracing part of yesterday's gain. Considering the significance in the candle formation, I'm sticking to yesterday's call and buying USD on pullbacks.
The only exception is NZDUSD that is refusing to participate in the USD selloff and drops further making it the relative strength loser. Such weakness points to significant selling pressure that is likely not going to stop. Selling NZD on strength is recommended.
Tuesday, September 1, 2009
USD closing strong, equities and commodities weak. Additional momentum likely
USD closed the day very strong across the board. USD index held the 78 - 77.80 level, bounced nicely and almost touched the 79 level. Majors are closing very weak against the USD and additional follow through is likely. Liquidity may not be yet great but end of summer might bring more players into the game. Hopefully we will break out of summer ranges and get some decent momentum.
10, 20, 30 emas are nicely stacked pointing to additional USD strength. Buy USD on pullback to 10 ema or place USD buy stop orders above swing high/below swing low. GBPJPY looks just awful and we can pray for a test of 151.30-50 area to get short.
Huge triangles on EURUSD and gold. Breakout likely to happen soon.
Changing dynamics in the market that were mentioned yesterday are exhibiting today again. ISM manufacturing (above 50 finally...) and pending home sales both significantly higher than expected and yet USD is higher across the board. US equities took a 1.5% dive and commodities look pretty weak as well (oil below 69 and gold below 950). Risk appetite and USD weakness that we used to see as a consequence of a positive news releases have disappeared.
Looking at the charts I see two huge triangles on EURUSD and XAUUSD. The breakout looks to be imminent and while no one knows which way they will break, when they break it will be a large move. Global equities, especially Chinese, don't look too good, break lower in oil would send USD higher. EURUSD daily looks to be in a topping formation so if I had to choose... I'd buy USD.
Good trades.
Monday, August 31, 2009
Changing market dynamics: equities and commodities down and USD down as well
Interesting developments today. Staggering 5.6% loss in Chinese equities is weighting on commodities as oil slips back below the key $70 price level and gold has not been able to sustain last week's gains either. US equities are currently down about 1%. Over the past many months such price action would imply strength in the buck. Not today. USD is down across the board. Even USDCAD is barely changed despite the fall in oil. JPY is the broad winner today after democratic party won Japanese election for the first time in 50 years.
When it comes to trading signals I'd recommend buying USDCAD especially in light of today's worse than expected GDP number (0.1% vs 0.2% expected) and falling oil price. USDCAD just touched our 30 hour ema which warrants a long position with stop at swing low bellow 1.0955. Williams' %R pretty close to oversold levels confirms this setup.
Good trades.
Friday, August 28, 2009
Majors little changed after yesterday's massive reversal
Summer trading with it's thin liquidity at it's best... After yesterday's massive reversal majors are little changed compared to closing prices. Unemployment in Japan hit record high, UK economy shrank less than expected and US consumer spending was up slightly but less than expected.
Gold and oil exploded yesterday but there has been only a little follow through. US equities are in red and over the past few minutes risk aversion seems to be creeping back into the markets. Considering that it's Friday and market has not revealed where it wants to go the best thing to do is wait for the next setup.
Thursday, August 27, 2009
Wow!!! The importance of stops!!!
Massive reversal happening now just confirms the importance of using stops. Completely unpredictable move that happened over the past few minutes took my stops out. Risk trades came back with vengeance - equities, oil, gold, high yielders all up. USDCHF broke down 140 points in matter of few minutes. Retrace is likely but considering the severity of the move additional USD weakness is likely. Changing strategy to sell USD on strength.
Good trades
Good trades
Not much follow through despite oil below $70
Majors are little changed since yesterday. GBPUSD broke to a new low 6152 but retraced a bit. JPY crosses are slightly down but failed to create lower lows compared to yesterday. Surprisingly, even USDCAD has not moved much since yesterday despite oil plunging below psychologically important $70 figure.
US news brought preliminary GDP figures coming at -1% (still better than expected -1.4%). Important unemployment claims edged up higher to 570K from last week's 562K.
10, 20 and 30 ema's are nicely stacked for a bullish move in USDCHF. Place a buy stop above yesterday's high 1.0713. Should the market decide that higher prices are warranted the order will fill you in. Or you can buy a test of 20 hour ema around 0680 with stop below 1.0660
Similar strategy could be used for USDCAD. Buy a break above 1.10 - should this level give way 1.11 is next. However, take profit there as strong resistance from previous highs may stall the up move.
Good trades
Wednesday, August 26, 2009
USDCHF and USDCAD charts looking essentially the same
Bullish move in USD can be nicely seen on USDCHF and USDCAD charts. On both charts the price broke important trendlines that will now work as a support. Price has also broken 10, 50, 100 and 200 EMAs and unless we break back down (which is very unlikely now) the emas will stack up nicely in the correct bullish order. For today the move seems exhausted so you may want to close existing positions to realize profit and buy again on pullbacks to the 10 EMA. US equities are back in the red, risk aversion intensifies, high yielding currencies are sold in favor of USD. This move is not over yet. For now, stick to buying USD on pullbacks.
Subscribe to:
Posts (Atom)