You can view an example of one of my recent analysis here:
Falling equity markets; EURUSD finally below 1.30
The original article from 5. 5. 2010 can be found here:
http://www.fxstreet.cz/patrik-urban+akciove-trhy-padaji-eurusd-konecne-pod-130.html
Sunday, May 23, 2010

Thursday, January 28, 2010
Please note that since November 2009 my articles, commentaries and FX analysis have been published on FXstreet.cz
Please note that since November 2009 my articles, commentaries and FX analysis have been published on www.fxstreet.cz. Since January 2010 they also appear on www.ihned.cz in the investment section.
List of analysis can be found here:
http://www.fxstreet.cz/patrik-urban.html
My articles appear here:
http://fxstreet.cz/clanky.html
Analysis and commentaries are also published here:
http://investice.ihned.cz/
Their list can be found here:
http://ihned.cz/index.php?article[aut_id]=13220680|13276070&p=000000_authoroverview
For translation please insert the URL of the article or copy and paste the text here:
http://translate.google.com/#cs|en|
List of analysis can be found here:
http://www.fxstreet.cz/patrik-urban.html
My articles appear here:
http://fxstreet.cz/clanky.html
Analysis and commentaries are also published here:
http://investice.ihned.cz/
Their list can be found here:
http://ihned.cz/index.php?article[aut_id]=13220680|13276070&p=000000_authoroverview
For translation please insert the URL of the article or copy and paste the text here:
http://translate.google.com/#cs|en|
Wednesday, November 18, 2009
Huge triangle on GBPJPY broken to the downside
GBPJPY was stuck within a huge triangle for quite some time now. For this very volatile pair long term consolidation is unusual and especially over the past few days the daily range has been minimal. Price finally broke trendline support so we can expect relatively large move. Bollinger bands with standard settings of 20, 2 are very narrow which is often a precursor of a large move.
Price has clearly broken to the downside so short position with stop above daily range and above trendline resistance+upper BB. Stop is relatively wide but we can expect a large move so risk/reward is still favorable.
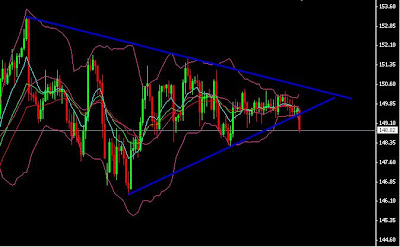
Price has clearly broken to the downside so short position with stop above daily range and above trendline resistance+upper BB. Stop is relatively wide but we can expect a large move so risk/reward is still favorable.

Thursday, November 5, 2009
medium term short opportunity in NZDUSD
The economic data from New Zealand disappointed again. Employment q/q fell again, this time by 0.8%, worse than expected -0.3% from -0.4% the previous quarter. Equally bad came out the unemployment number. Unemployment increased to 6.5%, exp. 6.4% from previous 6%.
Both numbers point to worsening labor market situation. Improvement in the labor market is necessary requirement for overall macroeconomic conditions of NZ so we will probably not be positively surprised by upcoming economic releases. New Zealand is an important exporter of dairy products and meat. We can be sure that the huge appreciation that the kiwi experienced (0.48 just in March!!!) is very negative for exporters. Fundamentally, NZDUSD should head down.
Looking at daily chart, we can see that the downtrend has already started. The price fell below 10, 20 and 30 EMA and broke below long term upward sloping trendline support. The price than retraced, tested this trendline (now resistance) and bounced off. The aformentioned EMAs started to point down which confirms that current trend is down.
For medium term trade with favorable risk/reward we can open short position at current price (around 7210) with stop above confluence of trendline resistance and 30 day EMA at 7320 risking 110 points. If the price breaks below previous low at 7094 it confirms that retracement of the bull move started and we will see significantly lower levels in the future.
Potentional risk is seen in continued USD selling with higher equities and commodities, especially gold and oil.

Both numbers point to worsening labor market situation. Improvement in the labor market is necessary requirement for overall macroeconomic conditions of NZ so we will probably not be positively surprised by upcoming economic releases. New Zealand is an important exporter of dairy products and meat. We can be sure that the huge appreciation that the kiwi experienced (0.48 just in March!!!) is very negative for exporters. Fundamentally, NZDUSD should head down.
Looking at daily chart, we can see that the downtrend has already started. The price fell below 10, 20 and 30 EMA and broke below long term upward sloping trendline support. The price than retraced, tested this trendline (now resistance) and bounced off. The aformentioned EMAs started to point down which confirms that current trend is down.
For medium term trade with favorable risk/reward we can open short position at current price (around 7210) with stop above confluence of trendline resistance and 30 day EMA at 7320 risking 110 points. If the price breaks below previous low at 7094 it confirms that retracement of the bull move started and we will see significantly lower levels in the future.
Potentional risk is seen in continued USD selling with higher equities and commodities, especially gold and oil.

Monday, November 2, 2009
Buy CAD, Euro near critical points
Markets were nervous today despite all positive news coming from the US. ISM and pending homes sales both surprised to the upside but after initial knee jerk reaction risk trades were sold off. Equities closed on the positive side but during the day there were many large moves both to the upside and to the downside.
USD index still looks good and if we hold 75.95 - 76 level there is a good chance that we will break to the upside forming a flagpole. It seems that inverted head and shoulder is being formed and upside break would target 77.30 area.
Gold is looking very well. It held a horizontal resistance turned support trendline, bounced off upward sloping channel line and it looks poised for another move higher. Only break below 1025 would turn biad down and that seem highly improbable now.
In currencies I'd like to point out a great CAD long opportunity. USDCAD daily has a nice downward sloping trendline that should provide strong selling pressure. Short positions are targetting 1.0630 the least and bias would turn up only if we break above 1.0845. EURCAD daily has a similar set up with clearly defined trendline.
EURUSD is very close to two critical points: bullish break of 1.4850 would signal resumption of a bullish move that would target 1.51 and bearish break of 1.4670 would signal that head and shoulders may be developing with neckline in 1.45 area. Buy stop and sell stop at these two areas with 50 pip stop loss and 150 pip limit make sense and provide excellent risk/reward ratio.


USD index still looks good and if we hold 75.95 - 76 level there is a good chance that we will break to the upside forming a flagpole. It seems that inverted head and shoulder is being formed and upside break would target 77.30 area.
Gold is looking very well. It held a horizontal resistance turned support trendline, bounced off upward sloping channel line and it looks poised for another move higher. Only break below 1025 would turn biad down and that seem highly improbable now.
In currencies I'd like to point out a great CAD long opportunity. USDCAD daily has a nice downward sloping trendline that should provide strong selling pressure. Short positions are targetting 1.0630 the least and bias would turn up only if we break above 1.0845. EURCAD daily has a similar set up with clearly defined trendline.
EURUSD is very close to two critical points: bullish break of 1.4850 would signal resumption of a bullish move that would target 1.51 and bearish break of 1.4670 would signal that head and shoulders may be developing with neckline in 1.45 area. Buy stop and sell stop at these two areas with 50 pip stop loss and 150 pip limit make sense and provide excellent risk/reward ratio.


Thursday, October 29, 2009
Risk trades are back after US GDP. For how long?
US GDP coming way better than expected at 3.5% brought back the risk trades. Long gone are times when better than expected US news meant stronger USD. In today's environment strong US data means recession is over, the economic patient is cured, we all sell the USD and live happily forever after. Well, let's see how tomorrows PMI numbers come out. If they disappoint, we could very easily lose today's gains in equities and commodities as risk aversion would likely come back.
As said before, USD was sold across the board (except against JPY of course). Gold bounced of two trendlines support and formed a nice bullish engulfing pattern. Bias would turn down only in case of a break of 1030.
The USD index broke a very important downward sloping trendline few days ago and came down to test it. In an ideal world it would bounce off this "resistance turned to support". If we hold 75.70 than the bias is still up.
I expect risk trades to continue (sell USD, buy equities and commodities)to continue through Asia and probably London session as well. However, if Chicago PMI disappoints than we could see a reversal. In EURUSD this idea translates to up move to 4920 (61.8% of move from 5060 to 4680) and then back down to 4700 area.
There is also an interesting set up in GBPUSD. Daily chart shows two resistance points: 6680 and 6745. We can expect a strong selling pressure there. However, if this level gives way, there is really no resistance above it and price should easily reach 1.7050 level (previous high)


As said before, USD was sold across the board (except against JPY of course). Gold bounced of two trendlines support and formed a nice bullish engulfing pattern. Bias would turn down only in case of a break of 1030.
The USD index broke a very important downward sloping trendline few days ago and came down to test it. In an ideal world it would bounce off this "resistance turned to support". If we hold 75.70 than the bias is still up.
I expect risk trades to continue (sell USD, buy equities and commodities)to continue through Asia and probably London session as well. However, if Chicago PMI disappoints than we could see a reversal. In EURUSD this idea translates to up move to 4920 (61.8% of move from 5060 to 4680) and then back down to 4700 area.
There is also an interesting set up in GBPUSD. Daily chart shows two resistance points: 6680 and 6745. We can expect a strong selling pressure there. However, if this level gives way, there is really no resistance above it and price should easily reach 1.7050 level (previous high)


Wednesday, October 14, 2009
USD collapsing, major psychological levels within reach
USD continues to collapse against virtually every currency. CHF parity first mentioned on 10/8 now seems even more likely as we trade around 1.0125. USDCAD in a strong downtrend is now trading just above 1.02 (150 points from a level where I first mentioned going short on Monday) is probably on the way to parity as well. EURUSD in now only a whisker from a major 1.5 level and now it would be almost impolite not to reach that level. The aussie continues its ascend as expected reaching a high of 92. Traders who followed my advice from last week to continue buying AUDUSD should have handsome profits by now.
Story of the day is Dow reaching 10000 and more importantly closing above this level at 10015. I still think that retracement (and probably a large one) will happen. But for now it does not make sense to fight the bullish trend.
USD index looks very poor again (or still?) and is closing very weak. Currently trading at candle's low around 75.27. The only hope now lies in a trendline support that comes around 75.15. Maybe will touch it when EURUSD breaks 1.50?
Gold made only marginally higher high but held yesterdays low and is closing reasonably strong. Oil which I mentioned last that there was a possibility of it breaking out of the recent range did break up higher and is on the way to touch 76.
When it comes to trading, my strategy does not change for now. Continue to sell USD on strength. Retracement is coming but so far there is no indication as to when it will come. Before I see any turns (hammers or at least doji, breaks of trendline supports/resistances or close below previous days lows/highs it doesn't make sense to fight the trend. Remember "trend is your friend". Keep your stops tight and be agressive with taking profits. Good trades.


Story of the day is Dow reaching 10000 and more importantly closing above this level at 10015. I still think that retracement (and probably a large one) will happen. But for now it does not make sense to fight the bullish trend.
USD index looks very poor again (or still?) and is closing very weak. Currently trading at candle's low around 75.27. The only hope now lies in a trendline support that comes around 75.15. Maybe will touch it when EURUSD breaks 1.50?
Gold made only marginally higher high but held yesterdays low and is closing reasonably strong. Oil which I mentioned last that there was a possibility of it breaking out of the recent range did break up higher and is on the way to touch 76.
When it comes to trading, my strategy does not change for now. Continue to sell USD on strength. Retracement is coming but so far there is no indication as to when it will come. Before I see any turns (hammers or at least doji, breaks of trendline supports/resistances or close below previous days lows/highs it doesn't make sense to fight the trend. Remember "trend is your friend". Keep your stops tight and be agressive with taking profits. Good trades.


Monday, October 12, 2009
USDCAD breaks support, downside momentum increases
As expected, the USD continues to be sold on rallies across the board (with the exception of GBP). One of the largest moves was seen against the Canadian dollar.
The CAD appreciated significantly after last Friday’s great labor report. Unemployment decreased greatly from 8.7% to 8.4% and number of jobs increased by 30.6 thousand vs. exp. 4.9 thousand confirming improving fundamentals.
Selling pressure was sufficient to break a trendline support at around 1.0450 and reached a low 1.0409. After a short period of consolidation the pair broke below the psychologically important 1.04 level and reached 1.0317 today. Daily chart shows a strong momentum to the downside and unless we break up and close around 1.04 (in which case the price would form a hammer formation) today’s close will be another huge bearish candle pointing to additional USDCAD weakness (CAD strength).
Placing a sell stop below today’s low at around 1.0310 with 1.0350 stop and 1.0240 limit looks like a good strategy to take advantage of the strong bearish momentum.

The CAD appreciated significantly after last Friday’s great labor report. Unemployment decreased greatly from 8.7% to 8.4% and number of jobs increased by 30.6 thousand vs. exp. 4.9 thousand confirming improving fundamentals.
Selling pressure was sufficient to break a trendline support at around 1.0450 and reached a low 1.0409. After a short period of consolidation the pair broke below the psychologically important 1.04 level and reached 1.0317 today. Daily chart shows a strong momentum to the downside and unless we break up and close around 1.04 (in which case the price would form a hammer formation) today’s close will be another huge bearish candle pointing to additional USDCAD weakness (CAD strength).
Placing a sell stop below today’s low at around 1.0310 with 1.0350 stop and 1.0240 limit looks like a good strategy to take advantage of the strong bearish momentum.

Thursday, October 8, 2009
Further AUD strength and USD weakness anticipated
The Aussie has behaved exactly as anticipated. AUD appreciated across the board reaching a high of 9090 against the buck (from 8918 in the last post when going long was advised). Last night's labor reports underpinned the aussie as unemployment dropped and the number of jobs created increased as well. The Australian economy is getting a firmer footing and if we continue to see positive news releases we may very well get another rate hike before the year end. The yield differential between the AUD and the rest of the world (especially the USD) will widen further and this should propel the AUD higher. The second recommendation to buy EURCHF at 5100 also worked out very nicely as we are trading at around 5180.
The greenback was sold across the board today and the USD index looks really poor. The price broke below all major support levels and unless we trade back above 76.50 the bias is clearly down. The USD is collapsing practically against all majors. All charts have important moving averages (10, 50, 100 or even 200 hour) stacked in a "correct" order pointing to strong momentum and further USD losses ahead. CHF parity anyone?
Spot gold reached higher levels again and one must ask whether oil will follow and break out of the relatively narrow range where is has been stuck for many months now. Again, if oil breaks out higher, the USD will continue its rapid decline.
As far as trading: do not fight the trend (at least not yet...) and do not buy the USD yet. The time may come but not now. So continue to sell USD on strength (test of 20 ema on hourly chart) preferably against fundamentally stronger currencies like the AUD.


The greenback was sold across the board today and the USD index looks really poor. The price broke below all major support levels and unless we trade back above 76.50 the bias is clearly down. The USD is collapsing practically against all majors. All charts have important moving averages (10, 50, 100 or even 200 hour) stacked in a "correct" order pointing to strong momentum and further USD losses ahead. CHF parity anyone?
Spot gold reached higher levels again and one must ask whether oil will follow and break out of the relatively narrow range where is has been stuck for many months now. Again, if oil breaks out higher, the USD will continue its rapid decline.
As far as trading: do not fight the trend (at least not yet...) and do not buy the USD yet. The time may come but not now. So continue to sell USD on strength (test of 20 ema on hourly chart) preferably against fundamentally stronger currencies like the AUD.


Subscribe to:
Posts (Atom)

 Posts
Posts

