Wednesday, November 18, 2009

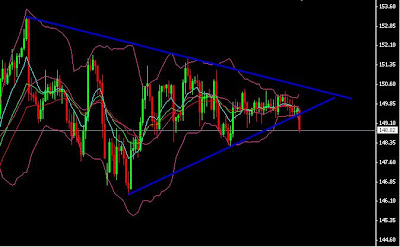
Huge triangle on GBPJPY broken to the downside

GBPJPY was stuck within a huge triangle for quite some time now. For this very volatile pair long term consolidation is unusual and especially over the past few days the daily range has been minimal. Price finally broke trendline support so we can expect relatively large move. Bollinger bands with standard settings of 20, 2 are very narrow which is often a precursor of a large move.

Price has clearly broken to the downside so short position with stop above daily range and above trendline resistance+upper BB. Stop is relatively wide but we can expect a large move so risk/reward is still favorable.

Thursday, November 5, 2009

medium term short opportunity in NZDUSD

The economic data from New Zealand disappointed again. Employment q/q fell again, this time by 0.8%, worse than expected -0.3% from -0.4% the previous quarter. Equally bad came out the unemployment number. Unemployment increased to 6.5%, exp. 6.4% from previous 6%.

Both numbers point to worsening labor market situation. Improvement in the labor market is necessary requirement for overall macroeconomic conditions of NZ so we will probably not be positively surprised by upcoming economic releases. New Zealand is an important exporter of dairy products and meat. We can be sure that the huge appreciation that the kiwi experienced (0.48 just in March!!!) is very negative for exporters. Fundamentally, NZDUSD should head down.

Looking at daily chart, we can see that the downtrend has already started. The price fell below 10, 20 and 30 EMA and broke below long term upward sloping trendline support. The price than retraced, tested this trendline (now resistance) and bounced off. The aformentioned EMAs started to point down which confirms that current trend is down.

For medium term trade with favorable risk/reward we can open short position at current price (around 7210) with stop above confluence of trendline resistance and 30 day EMA at 7320 risking 110 points. If the price breaks below previous low at 7094 it confirms that retracement of the bull move started and we will see significantly lower levels in the future.

Potentional risk is seen in continued USD selling with higher equities and commodities, especially gold and oil.

Monday, November 2, 2009

Buy CAD, Euro near critical points

Markets were nervous today despite all positive news coming from the US. ISM and pending homes sales both surprised to the upside but after initial knee jerk reaction risk trades were sold off. Equities closed on the positive side but during the day there were many large moves both to the upside and to the downside.

USD index still looks good and if we hold 75.95 - 76 level there is a good chance that we will break to the upside forming a flagpole. It seems that inverted head and shoulder is being formed and upside break would target 77.30 area.

Gold is looking very well. It held a horizontal resistance turned support trendline, bounced off upward sloping channel line and it looks poised for another move higher. Only break below 1025 would turn biad down and that seem highly improbable now.

In currencies I'd like to point out a great CAD long opportunity. USDCAD daily has a nice downward sloping trendline that should provide strong selling pressure. Short positions are targetting 1.0630 the least and bias would turn up only if we break above 1.0845. EURCAD daily has a similar set up with clearly defined trendline.

EURUSD is very close to two critical points: bullish break of 1.4850 would signal resumption of a bullish move that would target 1.51 and bearish break of 1.4670 would signal that head and shoulders may be developing with neckline in 1.45 area. Buy stop and sell stop at these two areas with 50 pip stop loss and 150 pip limit make sense and provide excellent risk/reward ratio.